
Part 1: Building a Transformer to Model Mineral Deposits
Introduction, data considerations and ideas

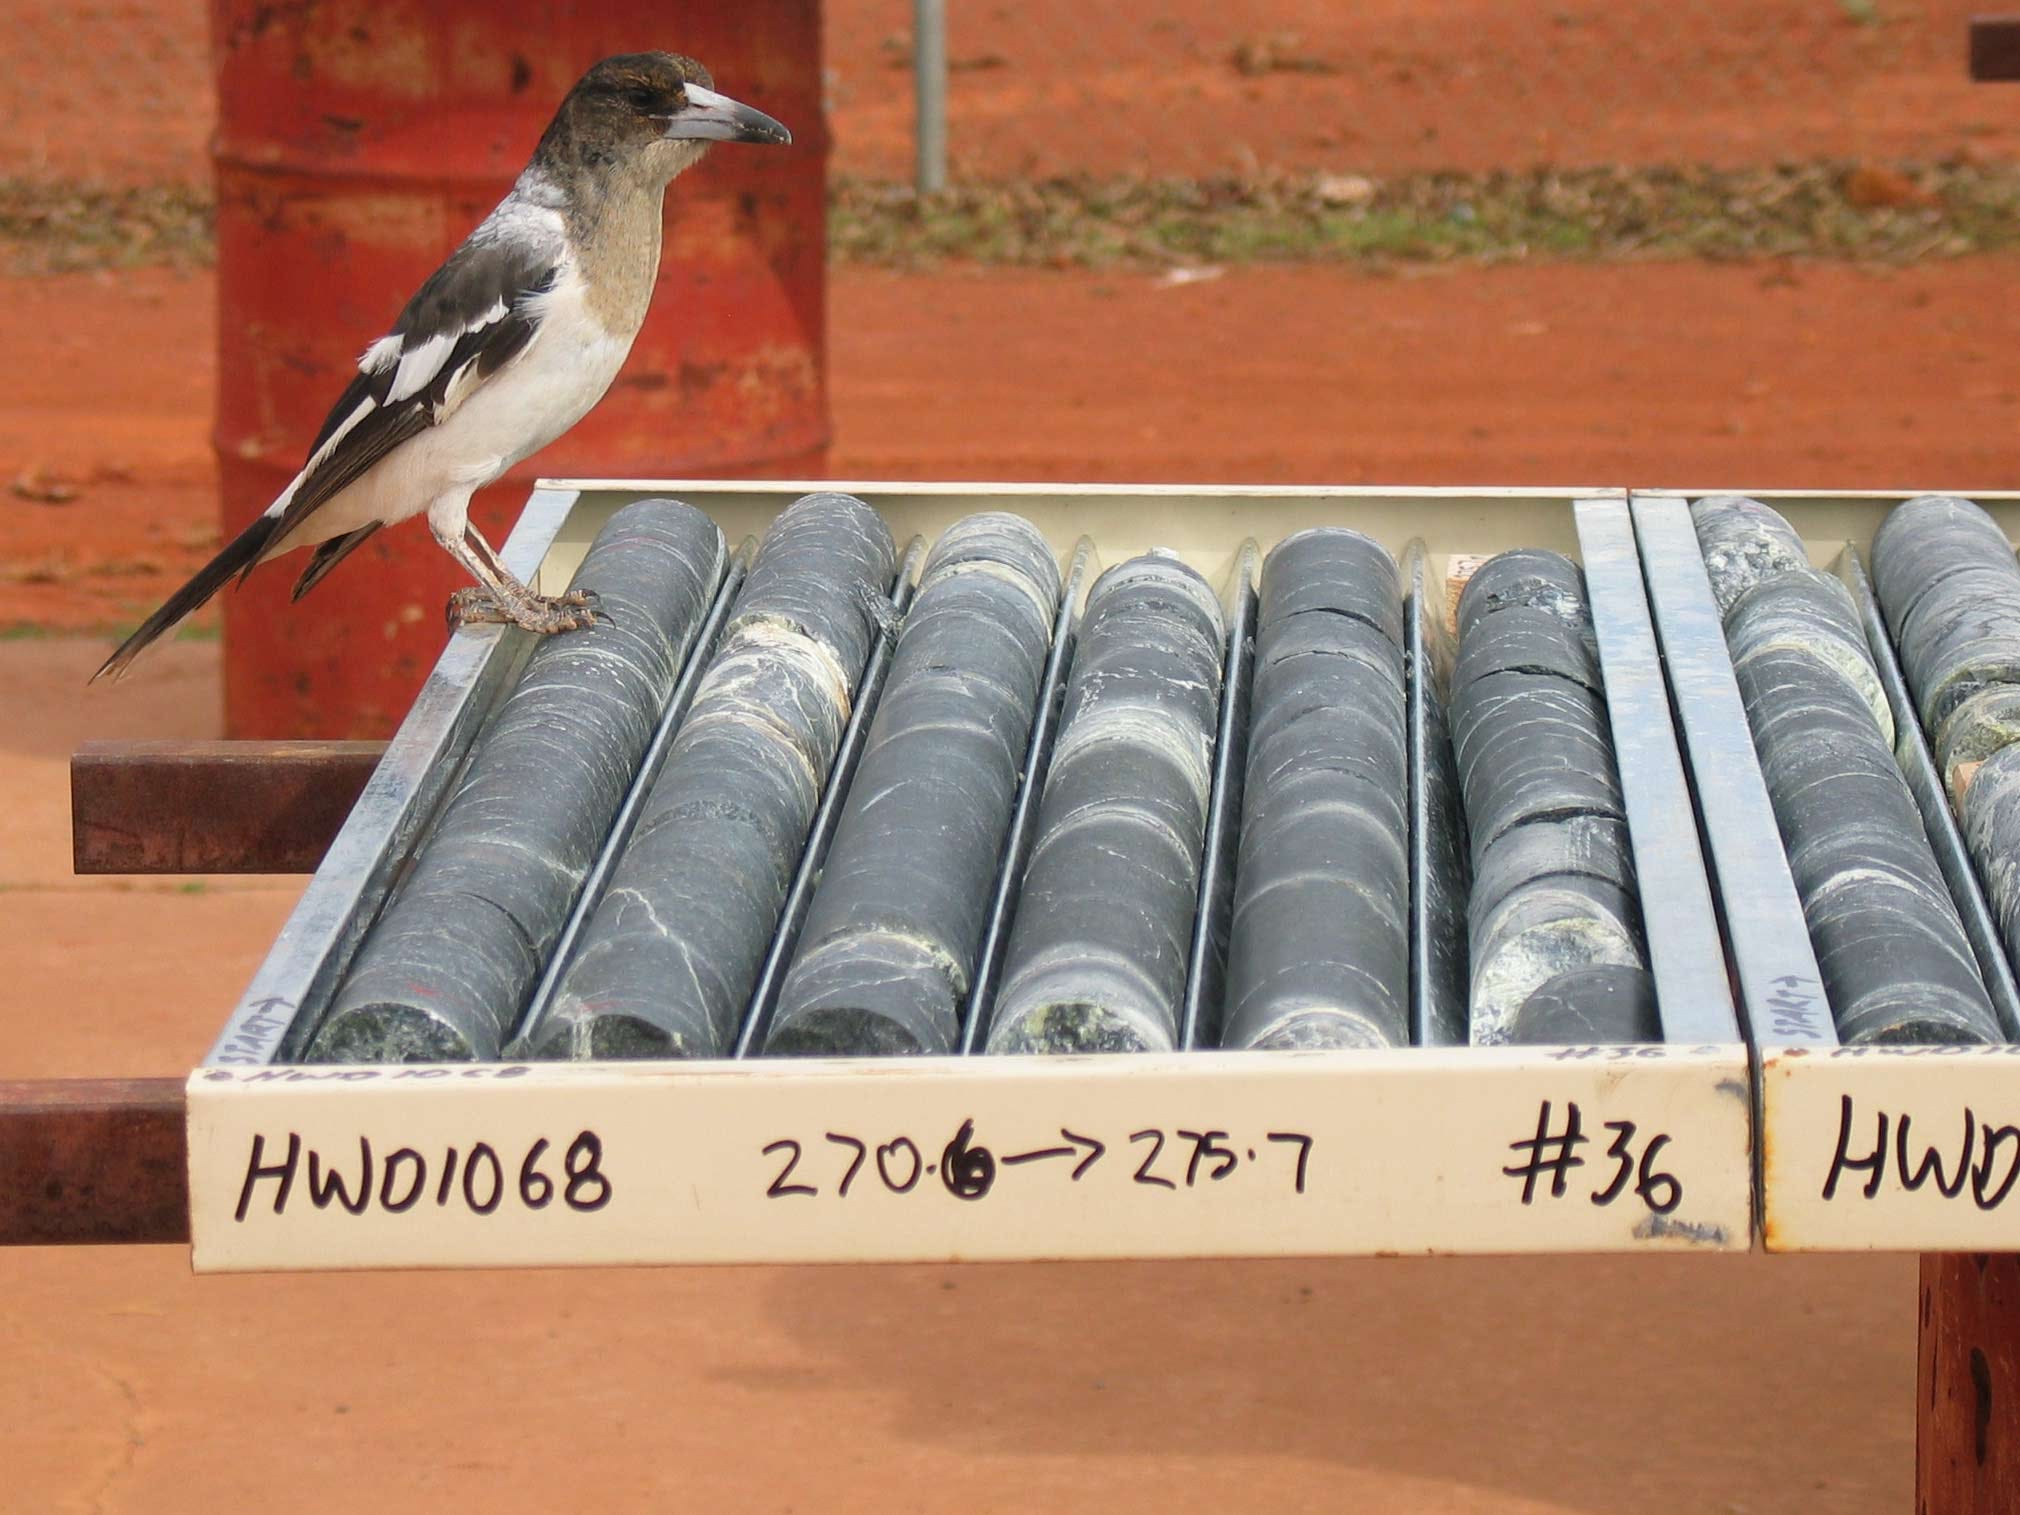
(Cover image lifted from Flynn Gold press release)
Hello! I am looking to practise writing (no AI here) while building an ML project in public (which should hopefully keep me somewhat accountable. For a bit of background I’m studying physics at the moment but have a long standing interest in ML and geology! Please share any ideas/comments you have (constructive or otherwise).
Very best case this project turns into something publishable, as I am yet to see anyone in the academic literature tackling this exact particular problem (if I’ve missed a paper please let me know!).
When a mining company (or government organisation) wants to know whats beneath the ground they stick a metal rod into it, get the rocks out (see above image) and send (a subset of them) to a lab to assay. A process which when you include permitting and such can take months, leading to very slow development.
What I want to do is given a dataset of assay results of drill holes (in 3 dimensions) is predict the assay results at some given coordinate at some nearby location. Which would besides answering the obvious question of is there gold here, could also be used to generate (very approximate) mineral resource estimations. My quant trading brain is screaming that the application to trading on small miners’ drilling results is obvious - although I should state I have no intention of doing this (this particular project is a purely academic journey).
I would also like to add more layers of data to the model, such as surface geochemistry (think rock-chip samples and stream sediment) as well as geophysical data. The issue is these datasets are often very incomplete and inconsistent even within locations. Geophysical data for instance has wildly varying resolution within and between states. However I suspect this data will absolutely be required to achieve a high level of accuracy.
The big issue with this particular modelling problem is no two deposits are exactly alike. So we need to give the model as good as a picture as possible of the geological environment - which is very difficult given assays are often incomplete and logging is non-standard.
Dataset
Lets discuss the data used. I’m using Northern Territory’s assay log which is surprisingly high quality. The other states’ data is less complete/standardised/readily available. I know Tasmania has a non-public dataset of similar calibre but I’ve sadly lost my copy of it.
The data is far from perfect - elevations are often missing (so need to be reconstructed from bearings). Azimuths (angle of the drill hole relative to north) are reported using a mixture of magnetic and true north (luckily libraries exist to correct this).
Drill hole data is also notoriously noisy, but there are more pressing issues….
Bias in Dataset
This dataset has a couple biases that really need to be addressed, even if I don’t have any splendid solutions to them just now.
The biggest one is that drill holes are hardly random - you are going to go bust very quickly as a miner if your drilling strategy is randomly putting holes in the ground hoping to intersect something of interest. So (with few exceptions) this dataset represents 1-dimensional geochemical view going into the ground, conditional on someone (presumably someone reasonably qualified too) having strong conviction that there is something interesting down there. And our target domain is whats beneath the ground conditional on that no ones bothered checking yet.
This problem is made even worse by that it is rare to assay the whole core. Instead geologists selectively sample sections of the core that are worth assaying.
So we have a very biased sub-sample of what is already a biased sample.
As evidence of this, the dataset (clipping negative values to zero - which corresponds readings below detection limits) has a gold average of ~0.3 parts per million (PPM) where it has been assayed. For context the crustal average is 0.004 PPM. So our average is 75x higher than what we’d expect of a random crustal sample.
With this second issue the obvious solution is to set all non assayed sections of the drill hole to the crustal abundance value. To be honest the expectancy is probably a bit higher, but I don’t (yet) have a cleaner method for infilling the values.
Normalisation
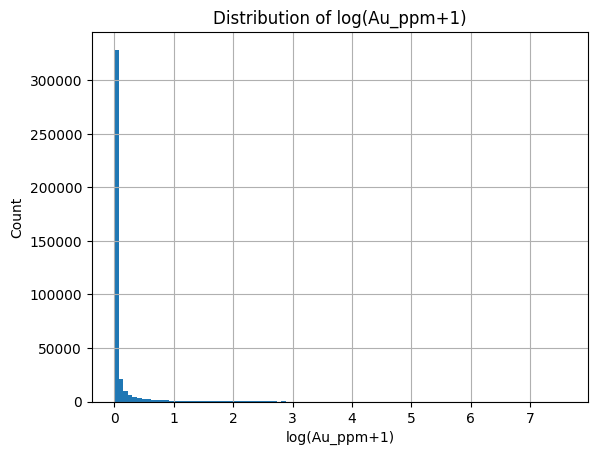
Clipping negative values to zero, we get the following distribution for gold PPM. This is not something that transformers (or any neural method is going to love). So we need to properly normalise values.
The normalisation is made tricky but the number of values at exactly zero/crustal abundance (when infilling) and the extreme right tail of the data. The most stable way I can think of to normalise this is through a Quantile Transformer. Basically we get the data, calculate its CDF empirically (i.e., the probability the gold reading is less than X PPM) and than plug the CDF readings into the inverseNorm function (CDF value to location on normal distribution).
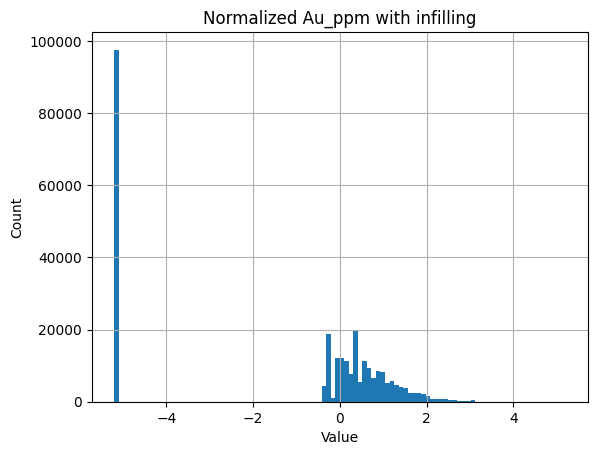
Now if we just infill values using crustal abundance we get this distribution. Which is better but still unlikely to be particularly NN friendly.
Now there is a fix to this - instead of infilling missing and below detection limit values with crustal abundance - we can instead infill using a random uniform value between zero and two times crustal abundance. This works as detection limit is typically >crustal abundance (at least for gold and silver), at least for historical (and still commonly used) fire assay methods.
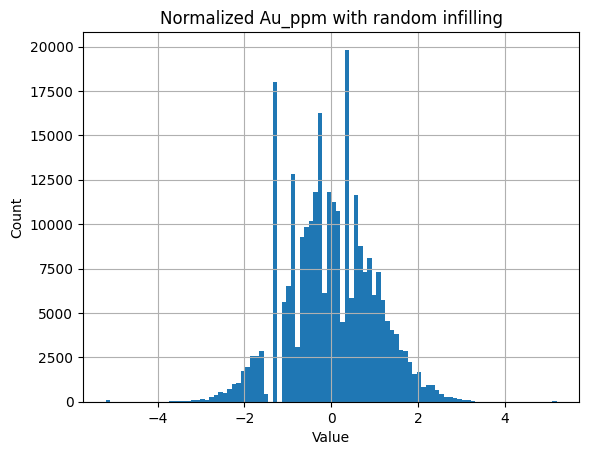
Now all the values left of -1.5 are randomly assigned and we get a much better behaved distribution. Note the four predominate spikes are caused by common lower detection limits. Part of me feels that adding so much entropy to our inputs will lead to problems - so I promise to test both variations as well as the raw CDF value (nicely bounded between 0 and 1).
Modelling Method
Now I want to use a transformer for this because they are incredibly good at modelling relationships, and we are given a lot of control over how it gets to model these relationships. Feel free to suggest alternative architectures.
Positional Embeddings
Now with something like a LLM there are a couple ways to model positions, sinusoidal, learnable and ROPE all come to mind. For our particular problem (our positions are in 3D and non discrete) I think sinusoidal embeddings are the best way to go.
As one of my experiments I may try learnable weights, where we take the weighted mean between two weights to get around the issue that weights require discrete positioning.
As we have a problem in 3D in non-discrete space, for the first pass I plan using an embedding dimension that is a multiple of 3 and than just adding the standard sinusoidal embedding to each section. E.g. if I choose embedding dim to be 96, the first 32 will have the X embedding, the next 32 the Y and so forth. This plan may not be optimal and I think I need to some reading on how its done.
The other thing I need to consider is where to choose an origin. As all our coordinates need to be relative to something. I think to begin with I will choose a random origin within the smallest box that contains all datapoints. This also allows for easy data augmentation, as I can choose many origins for the same group of points.
Architecture
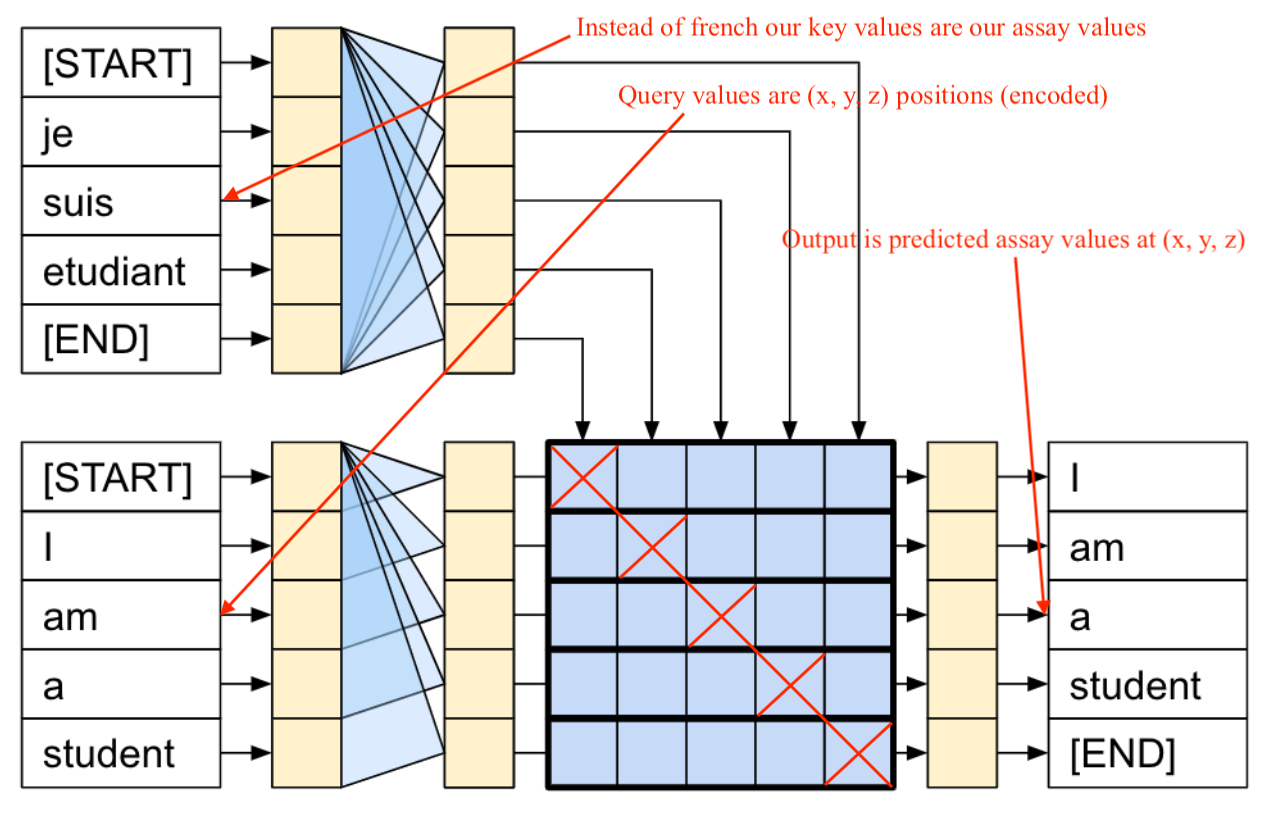
I plan on using the standard cross attention transformer, where the keys come from the assay values with position encodings and the query values are the position encodings themselves. Obviously we will need to use a mask to prevent the assay at a location attending (impacting) to the prediction at that same location - otherwise the model will learn nothing of use.
At a later stage I’d also like to experiment with Bayesian methods so we can generate uncertainty estimates, which in this context is critical.
Training & Other Details
I’m well aware I’ve done a lot of writing, so I’ll be light on detail here. But I think I’ll train on datapoints within a 350 metre radius (up to a maximum of a 1000 points, randomly subsampling down if required). This provides a good balance between having enough relevant data for each prediction on average and being able to fit on my GPU.
Over the course of this project I want to do a lot of experiments on the best configuration here - this radius is admittedly pretty arbitrary - so I’ll be keen to test others.
Evaluation & Success Criteria
A pet-peeve of mine is when folk announce some kind of loss/success/accuracy metric without adding any context to the number. So before I’ve written a working transformer lets consider some basic baselines.
Our prediction for some coordinate needs to be better than the inverse distance weighted mean of nearby samples. Like if we predict 1.00 PPM gold and it is 1.00 PPM gold great! But its hardly impressive if theres five different samples of the same reading within a 10 metre radius.
Another basic baseline I plan on building is an XGBoost model with relatively basic features (distance to nearest mineralisation, etc) that the transformer will need to outperform to justify its existence.
The other key evaluation is replicating mineral resource estimates - if some small miner announces 4 million tons at 1.20 PPM gold normally they include all the drill results that went into the estimation. It would be rather impressive if the model can replicate a very similar figure using the drill results as input and than grid searching the nearby area. This estimation work is done by very experienced geologists with advanced software, making this a high bar.
Out of sample greenfield (brand new projects) and brownfield (existing projects with know mineralisation) drill results would be the highest and most impressive benchmark. The cleanest way to do this would be to generate predictions on drill holes that a company has done but they haven’t received assays for. Though building a large dataset here would be a lot of work.
Visibility & Next Steps
I will be building in a public Github that I will attach in the next iteration of this
Part 2 where I actually train a (first pass) model with these ideas will be coming soon!
Cheers
Tom